
Retrieval-augmented generation: architecture that holds up in production
A working retrieval pipeline is straightforward. Making it reliable enough to trust with business questions is where the engineering is.
ZooBieDoo Infotech Engineering TeamRead
Forecasting adds value when planners act on it. That depends more on explaining uncertainty than on squeezing out accuracy.
Before any modelling, establish naive baselines: last period's value, the same period last year, a moving average. A meaningful share of forecasting projects produce models that do not beat these convincingly.
Publishing the baseline comparison keeps the project honest and gives an immediate answer to whether the sophistication is earning anything.
A point forecast implies precision the model does not have. Prediction intervals let a planner distinguish a confident forecast from a guess, and that distinction changes decisions.
Where the model has thin signal — new products, promotional periods, unusual events — say so explicitly and ask for human judgement rather than producing a number that looks like the others.
Planners will override forecasts, and sometimes they should. Capture every override with a structured reason and compare outcomes.
Reporting where the model beat the planner and where the planner beat the model, openly, is what builds the trust that gets forecasts used at all.
A forecast only creates value when it reaches a decision. That usually means integrating it into the tool where planning actually happens rather than delivering it as a separate report.
Present at the granularity decisions are made at — if buying is weekly by category, a daily item-level forecast forces the planner to aggregate it themselves, and many will not.
Provide the drivers alongside the number. A planner who can see why the forecast moved is far more likely to act on it than one presented with an unexplained figure.
Enough to cover several cycles of the seasonality you care about typically two to three years for annual patterns. Less history means wider intervals, which should be stated rather than hidden.
Similarity-based approaches using comparable items, combined with explicit human input. Any model will have thin signal here and should say so.
It depends entirely on the volatility of the series. The useful question is whether the forecast beats the baseline by enough to change decisions profitably.
Keep reading
A working retrieval pipeline is straightforward. Making it reliable enough to trust with business questions is where the engineering is.
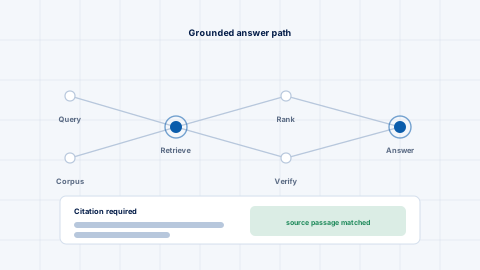
Connecting a language model to your documents is the straightforward part. The reliability work is everything after that, and it looks nothing like the demonstration.
Without an evaluation set, every change to a language model system is argued on anecdote. Building one is the highest-value early task.