Operations dashboards and control systems
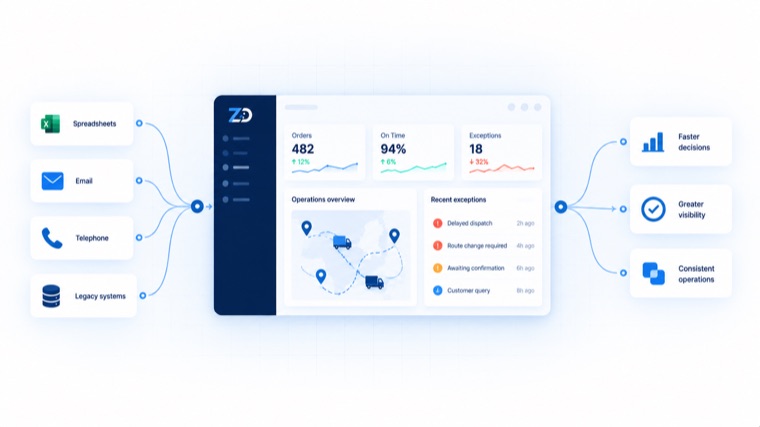
A single live picture of an operation for teams currently working from spreadsheets, email and telephone — built around the exceptions rather than the happy path.
Solution
Forecasts that planners actually use, because the system explains itself, shows its uncertainty and records the reasons for overrides.

A common pattern: an organisation invests in forecasting, the model performs acceptably in backtests, and the planners override it most of the time. Accuracy is then blamed, more accuracy is bought, and the override rate does not move.
The binding constraint is usually not accuracy. It is that the forecast arrives as a bare number with no explanation, no confidence range and no way to record why a human disagreed.
Meanwhile the business carries the cost: stock in the wrong places, markdowns at the end of the season, and planners maintaining private spreadsheets alongside the system that was supposed to replace them.
We treat the decision as the product rather than the prediction. That means interviewing planners, reviewing a season of override decisions against outcomes, and identifying where human judgement genuinely beats the model — typically new lines and promotional periods where signal is thin.
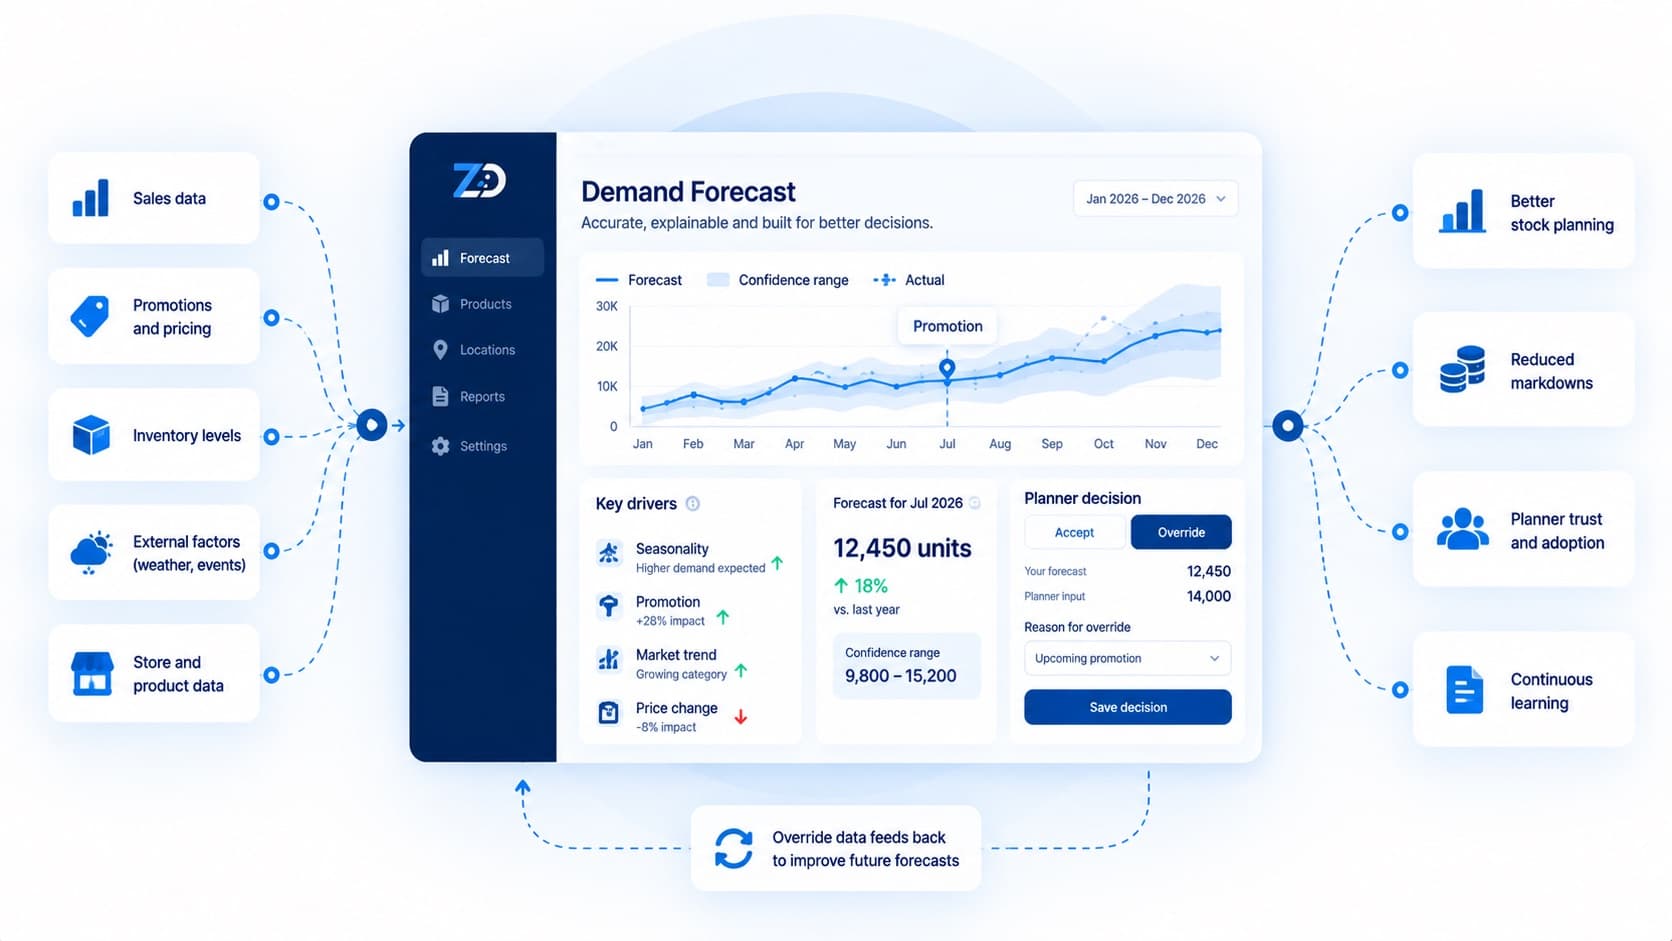
The system is then built to say so: explicit confidence intervals, drivers surfaced in plain language, an explicit low-confidence state that asks for judgement rather than guessing, and structured capture of every override.
Those overrides feed the next training cycle, and a periodic scorecard reports where the model beat the planner and where the planner beat the model. Publishing both is what builds the trust that gets forecasts used at all.
Capabilities
Reconciled across the levels the business plans at, so store, region and group agree.
Prediction intervals and an explicit low-confidence state instead of false precision.
The factors moving a forecast shown in plain language beside the number.
Every override recorded with a reason and fed back into training.
Similarity-based approaches for items with no history, flagged as such.
Delivered where planning actually happens, at the granularity decisions are made.
Outcomes
What this changes for the organisation once it is running. These are the outcomes the design targets, agreed with you as measures before build starts.
Technology
Indicative rather than fixed. The specific choices follow your existing estate, your team's skills and the constraints we find during discovery, and are recorded as architecture decisions before build.
| Area | Typical choices |
|---|---|
| Modelling | Python with gradient boosting, statistical methods and reconciliation |
| Data | PostgreSQL, BigQuery or Snowflake with orchestrated pipelines |
| Serving | Batch scoring with monitoring for drift and data quality |
| Interface | React planning workspace integrated with existing tooling |
A note on these pages. They describe the problem spaces we build for, how we approach them and the architecture we use. They are not client case studies and make no claim about specific engagements or results. Where a client agrees to be named, a full case study will be published in the same place.
More solutions

A single live picture of an operation for teams currently working from spreadsheets, email and telephone — built around the exceptions rather than the happy path.

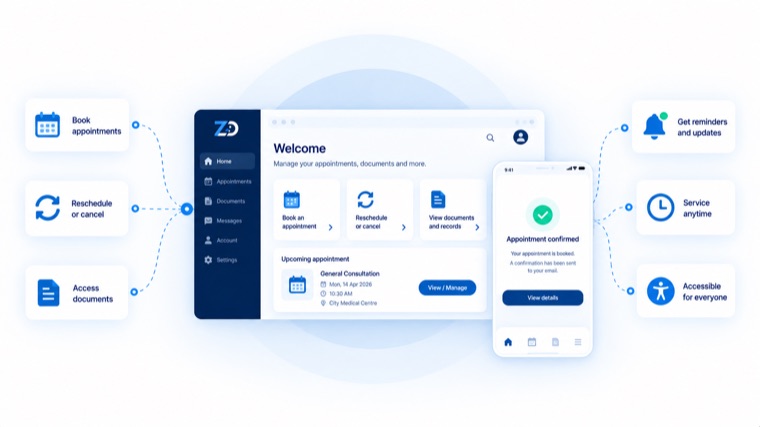
Self-service that genuinely reduces inbound contact, designed around the moments that decide whether someone completes the task or picks up the phone.

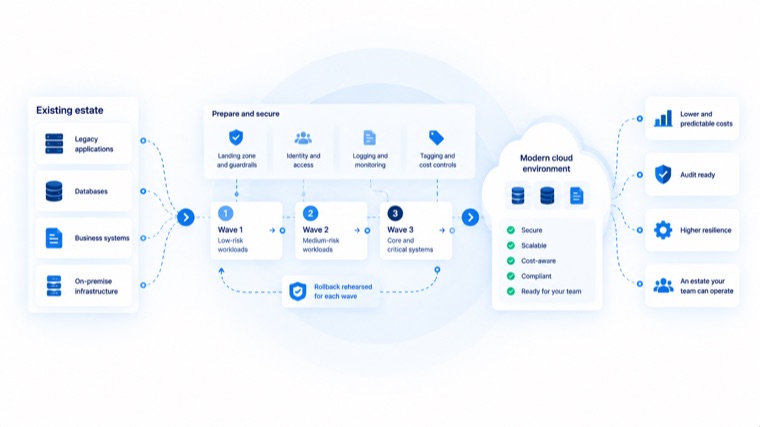
Moving an existing estate to cloud in rehearsed waves, with the landing zone, guardrails and cost attribution established before anything moves.
Start a conversation
An hour with our team, no charge and no obligation. You will leave with a point of view on the problem whether or not you work with us.
Monday to Saturday, 10:00 – 19:00 IST